Reproducible Analysis & Models for Predicting Genomics Workflow Execution Time (Midterm Blog Post)
Introduction
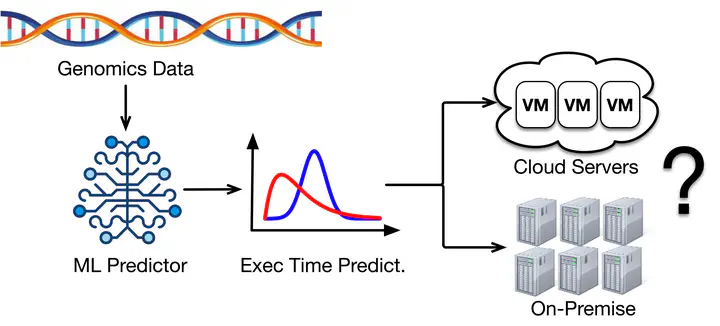
As part of the Reproducible Analysis & Models for Predicting Genomics Workflow Execution Time, our goal was to characterize the tools on genomic workflows in terms of system metrics and data quality to build machine learning models to predict the elapsed time of genomic workflows. While Shayantan (another contributor) did the analysis on data quality metrics, I contributed to the system metrics analysis. We are getting closer to that goal because we have managed to collect datasets and do some analysis.
Steps
In this project, we selected DNA-Seq Pipeline as the workflow to be analyzed. This pipeline consists of four tools for processing single-end reads, namely BWA-mem, Samtool-view, Picard-SortSam, Picard-MarkDuplicates. For each tool we executed it using various configurations and stored system metrics for each execution. To do this, we have to take two steps:
- Step 1: Building the tools execution environment.
- Step 2: Developing a program to execute tools using some configurations and collect runtime parameters (eg. CPU, RSS, VSZ, and IO) automatically.
Execution Environment
Tools are executed on Chameleon instances by submitting them using Slurm. The machine used in collecting system metrics is a Haswell instance of the Chameleon Texas server. This instance uses Intel(R) Xeon(R) CPU E5-2670 v3 @ 2.30GHz with following detailed specifications.
| Number of CPUs | 48 |
|---|---|
| Number of threads per core | 2 |
| Number of cores per socket | 12 |
| Number of sockets | 2 |
In this experiment, we use n+1 instances, where there are n compute nodes and 1 master node. Each execution is done by submitting a job, which is a tool with a certain configuration, from a master node and it will be processed by one of the compute nodes. In order for the tool to be executed, we need to set the master node to be a common container using NFS. This common container is used to store input files and commands for executing tools so that all nodes can access them without having to download and install them.
Executing and Collecting System Metrics
Tools will be executed in various specific configurations by varying parameters such as input size, number of CPU allocation, memory allocation and threads. For example, for BWA-mem respectively the number of variations in values for the number of CPU allocations, memory allocations, and threads is 5, 4, and 5 using 10 different files so that there are 5 x 4 x 5 x 10 = 1000 configuration combinations. For each configuration will be executed 8 times so that there are 8000 data points. Configuration details can be seen in the following table.
| #repetions | #files | #allocated CPU | #allocated memory | #threads | total | |
|---|---|---|---|---|---|---|
| BWA-mem | 8 | 10 | 2, 4, 8, 16, 32 | 8, 16, 32, 64 | 2, 4, 8, 16, 32 | 8000 |
| Samtool-view | 10 | 10 | 2, 4, 8, 16, 32 | 8, 16, 32, 64 | - | 2000 |
| Picard-Sortsam | 10 | 10 | 2, 4, 8, 16, 32 | 8, 16, 32, 64 | - | 2000 |
| Picard-MarkDuplicates | 10 | 10 | 2, 4, 8, 16, 32 | 8, 16, 32, 64 | - | 2000 |
Meanwhile, to run the tools, we use the following commands:
- BWA-mem
$BWA mem -t $threads $REF_DIR/hg19.fa ${INPUT_DIR}/${sra_id}*.fastq > ${OUTPUT_DIR}/${sra_id}.sam
- Samtool-view
$SAMTOOLS view $INPUT_DIR/${sra_id}.sam -Shb -o $OUTPUT_DIR/${sra_id}.bam
- Picard-SortSam
java -jar $PICARD SortSam \
CREATE_INDEX=true \
INPUT=$INPUT_DIR/${sra_id}.bam \
OUTPUT=$OUTPUT_DIR/${sra_id}.bam \
SORT_ORDER=coordinate \
VALIDATION_STRINGENCY=STRICT
- Picard-MarkDuplicates
java -jar $PICARD MarkDuplicates \
CREATE_INDEX=true \
INPUT=$INPUT_DIR/${sra_id}.bam \
OUTPUT=$OUTPUT_DIR/${sra_id}.bam \
METRICS_FILE=$OUTPUT_DIR/${sra_id}_rmd.txt \
VALIDATION_STRINGENCY=STRICT
In Slurm, each job has a job id. In addition, there is a scontrol listpids command to see the job id to PID mapping. Using this, we can obtain system metrics for a job by gathering information from the /proc/$PID system file. Information that can be obtained from it is the use of CPU, physical memory, virtual memory, read bytes, and write bytes at a particular time. So that in collecting this data, we will record these features along with the timestamp at 1 second intervals throughout the execution process.
Results
We also have calculated the correlation for each feature with the elapsed time. For BWA-mem, the features that correlate more than absolute of 0.5 are Input size, Average CPU Usage, and Output file size , which is in SAM format. For samtools there are input size, average cpu usage and output size in BAM. For Sortsam, there are input size, write operation, and BAM output size. For MarkDuplicates, there are input size and BAM output size.
| Features\Tools | BWA-mem | Samtool-view | Picard-SortSam | Picard-MarkDuplicates |
|---|---|---|---|---|
| Allocated CPU | -0.145 | -0.095 | -0.179 | -0.156 |
| Allocated physical memory | -0.010 | -0.038 | -0.069 | 0.132 |
| Input size | 0.583 | 0.651 | 0.937 | 0.922 |
| Threads | -0.072 | - | - | - |
| Average CPU | -0.607 | -0.567 | -0.479 | -0.480 |
| Peak CPU | -0.175 | 0.174 | -0.170 | 0.046 |
| Average RSS | 0.040 | 0.034 | 0.131 | 0.182 |
| Peak RSS | 0.068 | 0.046 | 0.314 | 0.175 |
| Average VSZ | 0.032 | -0.349 | -0.127 | 0.090 |
| Peak VSZ | 0.048 | 0.074 | -0.130 | 0.088 |
| Write bytes | 0.037 | 0.190 | 0.735 | 0.244 |
| Read bytes | -0.031 | 0.109 | 0.070 | 0.110 |
| Output SAM size | 0.589 | - | - | - |
| Output BAM size | - | 0.763 | 0.934 | 0.923 |
| Output BAI size | - | - | 0.400 | 0.399 |
Future Works
For further work, we will analyze the correlation between elapsed time and features whose scores are below an absolute 0.5. Because there is a possibility that these features are actually correlated with the elapsed time but do not appear to be correlated because the measurements are made by calculating the overall data. So we also need to calculate the feature correlation for each data grouped by input file. Then, we create a machine learning model to predict elapsed time.
Charis Christopher Hulu
Student at Calvin Institute of Technology
Charis Hulu is currently a senior undergraduate student in the IT and Big Data Analytics program at the Calvin Institute of Technology. His research interests are in machine learning and performance analysis of hybrid cluster.